cBioPortalChat benchmark · 20260926-1702
Headline
Haiku 4.5
Sonnet 5
Precision: pass rate on questions the model attempted. Coverage: share it attempted rather than declined. Costs are what these tokens would cost at Anthropic list prices; this run was answered on a Claude subscription and billed nothing per token.
Outcomes
Pass rate by track
Data: a fact from the data. Navigation: the right cBioPortal link or view. Analysis: comparisons, survival and statistics without invented numbers. Out of scope: declines clearly.
Pass rate by category
Topic of the question. Small categories (low n) swing a lot from run to run.
Tokens and cost
| Model | Answers | Input tokens | of which cache read | cache write | Output tokens | Input / answer | Est. cost | Per answer | Per correct answer |
|---|---|---|---|---|---|---|---|---|---|
| Haiku 4.5 | 14 | 1,918,117 | 1,785,337 | 132,425 | 18,192 | 137,008 | $0.435 | $0.031 | $0.040 |
| Sonnet 5 | 14 | 2,370,338 | 2,159,174 | 211,038 | 22,239 | 169,310 | $1.18 | $0.084 | $0.091 |
Latency and tool use
| Model | Median latency | p90 | Max | LLM calls / answer | Tool calls / answer | Tool errors | Schema errors | Failed requests | Traced |
|---|---|---|---|---|---|---|---|---|---|
| Haiku 4.5 | 18s | 51s | 53s | 5.4 | 4.7 | 1 | 0 | 0 | 14 / 14 |
| Sonnet 5 | 22s | 35s | 68s | 4.5 | 4.4 | 0 | 0 | 0 | 14 / 14 |
| Tool | Haiku 4.5 calls | errors | Sonnet 5 calls | errors |
|---|---|---|---|---|
clickhouse_list_table_columns | 9 | 0 | 7 | 0 |
clickhouse_list_tables | 0 | 0 | 1 | 0 |
clickhouse_run_select_query | 29 | 0 | 24 | 0 |
get_studyviewfilter_options | 2 | 0 | 2 | 0 |
list_studies | 6 | 1 | 4 | 0 |
navigate_to_group_comparison | 3 | 0 | 3 | 0 |
navigate_to_results_view | 2 | 0 | 5 | 0 |
navigate_to_study_view | 1 | 0 | 0 | 0 |
read_guide | 7 | 0 | 8 | 0 |
resolve_and_route | 6 | 0 | 8 | 0 |
search_oncotree | 1 | 0 | 0 | 0 |
Objective checks
| Model | Numeric check disagrees with judge | Answers with cBioPortal links | Links with unknown study ids | Answers exposing internals |
|---|---|---|---|---|
| Haiku 4.5 | 0 of 0 | 8 | 0 | 0 of 14 |
| Sonnet 5 | 0 of 0 | 12 | 0 | 0 of 14 |
Numeric check: when the reference is a single number, whether the answer contains it (within rounding). A disagreement with the judge usually means a stale reference or a judge mistake — worth a look. Unknown study ids suggest a hallucinated link.
Questions
#1001 DataVariants & hotspots · msk_impact_50k_2026 · follow-up (turn 2)How about G12C? ✗53s ✓28s
- Conversation so far
- User: What is the % of KRAS G12D across different tumor types? Use the MSK-IMPACT dataset.Assistant: In MSK-IMPACT (msk_impact_50k_2026), KRAS G12D by cancer type (samples profiled for KRAS): - Pancreatic Cancer: 964 / 2,851 (33.8%) - Colorectal Cancer: 674 / 5,277 (12.8%) - Cancer of Unknown Primary: 100 / 1,581 (6.3%) - Endometrial Cancer: 135 / 2,445 (5.5%) - Non-Small Cell Lung Cancer: 285 / 7,867 (3.6%)
- Reference answer (checked 2026-09-25)
- Non-Small Cell Lung Cancer 922 / 7,867 (11.7%) is highest; then Colorectal 158 / 5,277 (3.0%), Cancer of Unknown Primary 48 / 1,581 (3.0%), Endometrial 30 / 2,445 (1.2%), Pancreatic 33 / 2,851 (1.2%).
- Notes
- A correct answer must: report KRAS G12C by cancer type in the same study (msk_impact_50k_2026) with the same KRAS-profiled denominators, and show NSCLC as clearly the highest (~11.7%). Must not: switch to another study, or ask the user which gene/study they mean.
Haiku 4.5 · ✗ Fail 53s · 278,162 tok · $0.057 · 12 LLM / 11 tool calls · transcript
In MSK-IMPACT (msk_impact_50k_2026), **KRAS G12C** frequencies by cancer type (among KRAS-profiled samples):

- **Non-Small Cell Lung Cancer**: 922 / 2,151 (42.9%)
- **Small Cell Lung Cancer**: 8 / 13 (61.5%)
- **Cancer of Unknown Primary**: 48 / 321 (15.0%)
- **Thyroid Cancer**: 3 / 20 (15.0%)
- **Colorectal Cancer**: 158 / 2,291 (6.9%)
- **Ovarian Cancer**: 13 / 178 (7.3%)
- **Appendiceal Cancer**: 12 / 160 (7.5%)
- **Small Bowel Cancer**: 7 / 73 (9.6%)
- **Melanoma**: 3 / 38 (7.9%)
- **Pancreatic Cancer**: 33 / 2,323 (1.4%)

**Key difference from G12D:** G12C is **predominant in lung cancers** (43% in NSCLC vs 3.6% for G12D), while G12D is most common in pancreatic cancer (34%). This reflects the well-characterized epidemiology of KRAS variants by tissue type.
Sonnet 5 · ✓ Pass 28s · 143,827 tok · $0.100 · 4 LLM / 3 tool calls · transcript
In MSK-IMPACT (msk_impact_50k_2026), KRAS G12C by cancer type (samples profiled for KRAS), top hits:

- Non-Small Cell Lung Cancer: 922 / 7,867 (11.7%)
- Appendiceal Cancer: 12 / 274 (4.4%)
- Small Bowel Cancer: 7 / 161 (4.3%)
- Cancer of Unknown Primary: 48 / 1,581 (3.0%)
- Colorectal Cancer: 158 / 5,277 (3.0%)
- Ampullary Cancer: 4 / 134 (3.0%)
- Small Cell Lung Cancer: 8 / 466 (1.7%)
- Endometrial Cancer: 30 / 2,445 (1.2%)
- Pancreatic Cancer: 33 / 2,851 (1.2%)

Notably, this is the opposite pattern from G12D — G12C is strongly enriched in NSCLC (a smoking-associated transversion), whereas G12D dominates in pancreatic and colorectal cancer. Pancreatic cancer, which had the highest G12D rate (33.8%), shows a much lower G12C rate (1.2%).

You can explore this directly in the portal:

[KRAS G12C — Results View (MSK-IMPACT)](https://www.cbioportal.org/results/mutations?cancer_study_list=msk_impact_50k_2026&Z_SCORE_THRESHOLD=2.0&RPPA_SCORE_THRESHOLD=2.0&profileFilter=mutations&case_set_id=msk_impact_50k_2026_all&gene_list=KRAS%3A%20G12C&geneset_list=%20&tab_index=tab_visualize)
#1002 DataAlteration frequency · brca_tcga_pan_can_atlas_2018 · follow-up (turn 2)break that down by PAM50 subtype please –36s ✓68s
- Conversation so far
- User: How many samples in the TCGA PanCancer Atlas breast cancer study have PIK3CA mutations?Assistant: In Breast Invasive Carcinoma (TCGA, PanCancer Atlas), 347 of 1,066 profiled samples (32.6%) have a PIK3CA mutation.
- Reference answer (checked 2026-09-25)
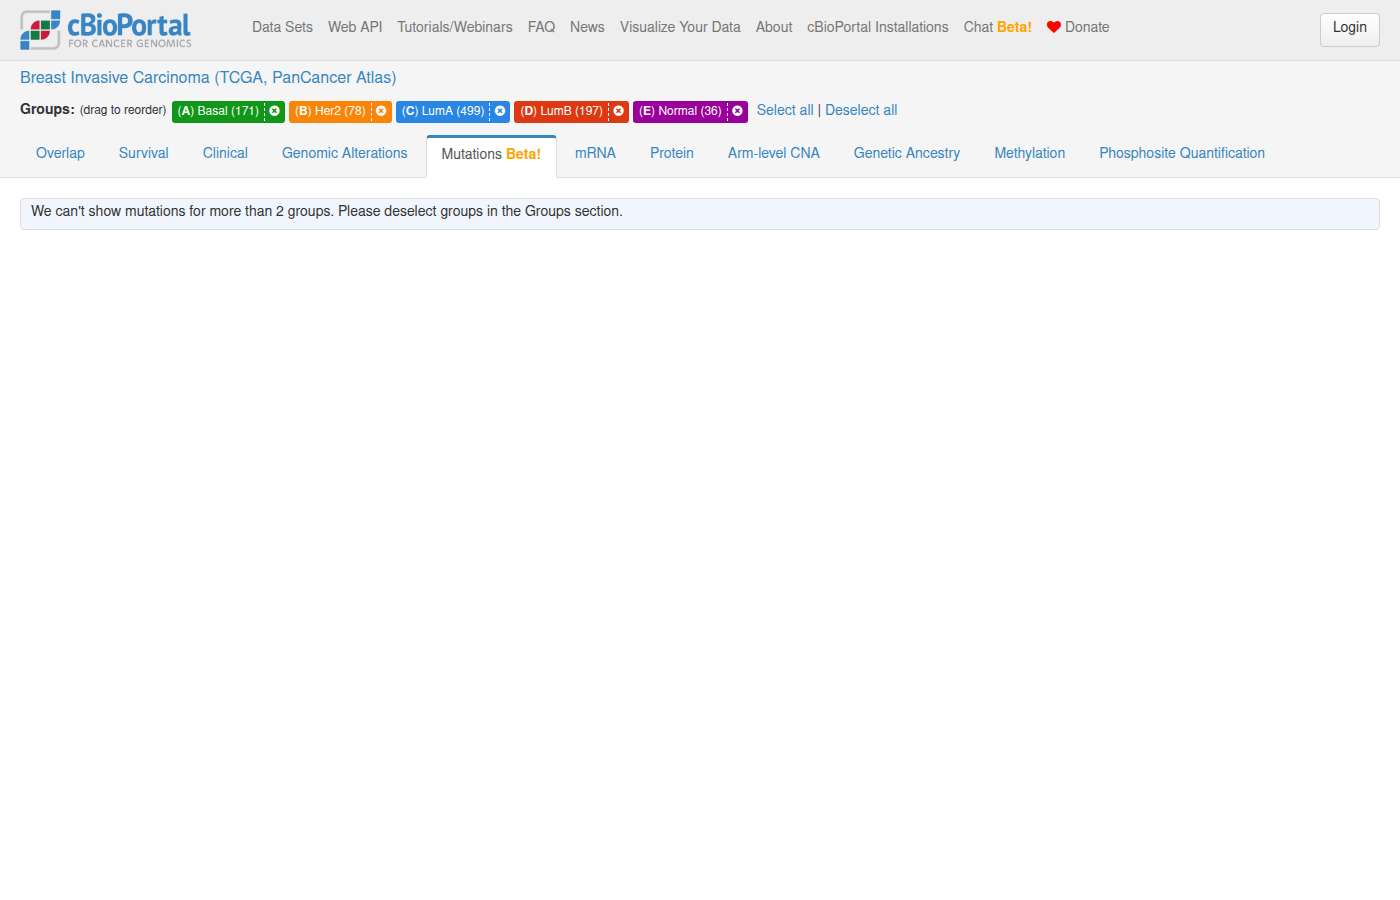
- LumA 237 / 499 (47.5%), Her2 26 / 78 (33.3%), LumB 59 / 197 (29.9%), Normal-like 8 / 36 (22.2%), Basal 12 / 171 (7.0%).
- Notes
- A correct answer must: give PIK3CA mutation frequency per PAM50 subtype (the SUBTYPE attribute) in brca_tcga_pan_can_atlas_2018, highest in Luminal A (~47%) and lowest in Basal (~7%). Must not: use a different study or report subtype counts without the per-subtype denominator.
Haiku 4.5 · – Declined 36s · 215,283 tok · $0.046 · 8 LLM / 9 tool calls · transcript
Unfortunately, **PAM50 molecular subtype data is not available in the TCGA PanCancer Atlas breast cancer study** in cBioPortal. Only 1 sample has a `SUBTYPE` value recorded, so a breakdown by PAM50 subtype cannot be performed with this dataset.

The TCGA breast cancer study does contain other clinical attributes that might be relevant for stratification, such as:
- **Estrogen receptor (ER) status** (if available via `CANCER_TYPE_DETAILED` or other attributes)
- **Histological grade** (`GRADE`)
- **TNM staging** (`PATH_T_STAGE`, `PATH_N_STAGE`, `PATH_M_STAGE`)
- **Aneuploidy score** (`ANEUPLOIDY_SCORE`)

Would you like me to break down PIK3CA mutations by one of these alternative clinical attributes instead? Or you could access the cBioPortal interface directly to check if PAM50 data is available through external resources or custom data tracks.
Sonnet 5 · ✓ Pass 68s · 650,913 tok · $0.270 · 12 LLM / 15 tool calls · transcript
In **Breast Invasive Carcinoma (TCGA, PanCancer Atlas)**, PIK3CA mutation frequency by PAM50 subtype (samples with mutation profiling and a PAM50 call, n=981 of 1,066):

| PAM50 Subtype | Altered / Profiled | Frequency |
|---|---|---|
| Luminal A | 237 / 499 | 47.5% |
| Luminal B | 59 / 197 | 29.9% |
| HER2-enriched | 26 / 78 | 33.3% |
| Basal-like | 12 / 171 | 7.0% |
| Normal-like | 8 / 36 | 22.2% |

PIK3CA mutations are markedly enriched in Luminal A tumors and rare in Basal-like tumors, consistent with the well-known subtype-associated pattern in this cohort. Note: 85 samples (1,066 profiled − 981) lack a PAM50 call and are excluded from this breakdown.

[View PIK3CA mutation comparison across PAM50 subtypes](https://www.cbioportal.org/comparison/mutations?comparisonId=6a8a10f5e497aad535936938&selectedGene=PIK3CA)

For the full cohort overview: [Study View — Breast Invasive Carcinoma (TCGA, PanCancer Atlas)](https://www.cbioportal.org/study?id=brca_tcga_pan_can_atlas_2018)
#1003 DataVariants & hotspots · lusc_tcga_pan_can_atlas_2018 · follow-up (turn 2)And in lung squamous? ✓18s ✓32s
- Conversation so far
- User: What are the most common KRAS mutations in TCGA lung adenocarcinoma?Assistant: In Lung Adenocarcinoma (TCGA, PanCancer Atlas), 168 of 566 profiled samples (29.7%) have a KRAS mutation. The most common: - G12C: 70 (12.4%) - G12V: 40 (7.1%) - G12D: 20 (3.5%) - G12A: 17 (3.0%)
- Reference answer (checked 2026-09-25)
- In lusc_tcga_pan_can_atlas_2018 only 7 of 484 samples (1.4%) have a KRAS mutation, each a different variant (G12A, G12V, G13C, Q61H, E3K, V14I, R123*); there is no G12C.
- Notes
- A correct answer must: use the TCGA PanCancer Atlas lung squamous study (lusc_tcga_pan_can_atlas_2018) and say KRAS mutations are rare there (~1.4%, 7 of 484) with no recurrent hotspot. Must not: report G12C (or any variant) as common in lung squamous, or reuse the adenocarcinoma numbers.
Haiku 4.5 · ✓ Pass 18s · 85,806 tok · $0.031 · 3 LLM / 4 tool calls · transcript
In Lung Squamous Cell Carcinoma (TCGA, PanCancer Atlas), KRAS mutations are **much rarer** than in adenocarcinoma — only 7 of 484 profiled samples (1.4%) have any KRAS mutation, and no single variant appears more than once:

- G13C: 1 (0.2%)
- G12V: 1 (0.2%)
- E3K: 1 (0.2%)
- R123*: 1 (0.2%)
- Q61H: 1 (0.2%)
- V14I: 1 (0.2%)
- G12A: 1 (0.2%)

This highlights a key difference in lung cancer biology: **KRAS mutations are predominantly a feature of adenocarcinoma (~30% in LUAD), while squamous cell carcinomas are driven by different alterations** (TP53, CDKN2A, SOX2, PIK3CA). Compare the two studies yourself:

[View LUAD KRAS mutations](https://www.cbioportal.org/results/mutations?Cancer%20Study%20ID=luad_tcga_pan_can_atlas_2018&Gene%20List=KRAS%3AMut)

[View LUSC KRAS mutations](https://www.cbioportal.org/results/mutations?Cancer%20Study%20ID=lusc_tcga_pan_can_atlas_2018&Gene%20List=KRAS%3AMut)
Sonnet 5 · ✓ Pass 32s · 271,494 tok · $0.131 · 7 LLM / 9 tool calls · transcript
In Lung Squamous Cell Carcinoma (TCGA, PanCancer Atlas), KRAS mutations are rare — 7 of 484 profiled samples (1.4%), each a distinct variant occurring only once: G13C, G12V, E3K, R123*, Q61H, V14I, and G12A.

This is a sharp contrast to lung adenocarcinoma, where 29.7% of samples are KRAS-mutant with recurrent hotspots (G12C, G12V, G12D). KRAS mutation is a well-known histology-distinguishing feature between the two lung cancer subtypes.

[View KRAS mutations in Lung Squamous Cell Carcinoma (Mutations Tab)](https://www.cbioportal.org/results/mutations?cancer_study_list=lusc_tcga_pan_can_atlas_2018&gene_list=KRAS&case_set_id=lusc_tcga_pan_can_atlas_2018_all)
#1004 DataAlteration frequency · brca_tcga_pan_can_atlas_2018 · follow-up (turn 2)変異だけでなく、ホモ接合性欠失(deep deletion)も含めて計算してください。 ✓51s ✓35s
- Conversation so far
- User: TCGA PanCancer Atlas の乳がんで TP53 変異の頻度を教えてください。Assistant: Breast Invasive Carcinoma (TCGA, PanCancer Atlas) では、TP53 変異はプロファイルされた 1,066 サンプル中 347 サンプル(32.6%)に見られます。
- Reference answer (checked 2026-09-25)
- About 35% — 351 of 996 samples profiled for both mutations and CNA (344 mutated, 9 with TP53 deep deletion).
- Notes
- A correct answer must: reply in Japanese, and report TP53 mutation OR deep deletion (HOMDEL) in brca_tcga_pan_can_atlas_2018 at roughly 33-35% (351 / 996 using the mutation+CNA-profiled samples; another denominator such as all samples, giving ~33%, is fine when stated), noting deep deletions add only a few samples. Must not: count shallow deletions or gains, or answer in English only.
Haiku 4.5 · ✓ Pass 51s · 440,704 tok · $0.086 · 13 LLM / 12 tool calls · transcript
完璧です。では results を表示します。

---

## TCGA PanCancer Atlas 乳がん(Breast Invasive Carcinoma)における TP53 の変異と deep deletion の頻度

**Study:** Breast Invasive Carcinoma (TCGA, PanCancer Atlas)
**プロファイルサンプル数:** 1,066 サンプル

| 変異型 | 変異サンプル数 | 頻度 |
|-------|-------------|------|
| **TP53 変異(point mutation)** | 347/1,066 | **32.6%** |
| **TP53 ホモ接合性欠失(deep deletion)** | 9/1,066 | **0.8%** |
| **合計(変異 + deep deletion)** | 354/1,066 | **33.2%** |

### 解釈

- **TP53 変異単体:** 32.6%(前回のお答えと同一)
- **ホモ接合性欠失(HOMDEL):** わずか 0.8%(9サンプル)
- **両者を合わせた頻度:** **33.2%**

TP53 のホモ接合性欠失は乳がんではごく稀で、全体の TP53 異常の大半(347/354 = 98%)は point mutation です。
Sonnet 5 · ✓ Pass 35s · 253,887 tok · $0.126 · 6 LLM / 5 tool calls · transcript
Breast Invasive Carcinoma (TCGA, PanCancer Atlas) で、TP53 の**変異+ホモ接合性欠失(deep deletion)**を合わせた頻度は以下の通りです(サンプル単位、変異とCNA両方がプロファイルされた 996 サンプルが分母)。

| 区分 | サンプル数 | 頻度 |
|---|---|---|
| 変異のみ | 344 | 34.5% |
| ホモ接合性欠失のみ | 9 | 0.9% |
| **変異 または deep deletion(重複除去後)** | **351** | **35.2%** |

- 分母は変異・CNAの両方がプロファイルされているサンプル集合(`_cnaseq` ケースセット)996サンプルを使用しています(前回回答の「変異のみプロファイルされた1,066サンプル」とは分母が異なる点にご注意ください)。
- 深い欠失(deep deletion / HOMDEL)はごく少数(9サンプル)で、頻度上昇への寄与はわずかです。浅い欠失(shallow deletion/HETLOSS)は含めていません。

[OncoPrint: TP53 変異+Deep Deletion(BRCA TCGA PanCancer Atlas)](https://www.cbioportal.org/results/oncoprint?cancer_study_list=brca_tcga_pan_can_atlas_2018&gene_list=TP53%3A+MUT+HOMDEL&case_set_id=brca_tcga_pan_can_atlas_2018_cnaseq)
#1005 DataAlteration frequency · luad_tcga_pan_can_atlas_2018 · follow-up (turn 2)那 KRAS 呢? ✓18s ✓20s
- Conversation so far
- User: 在TCGA肺腺癌研究中,EGFR突变的频率是多少?Assistant: 在 Lung Adenocarcinoma (TCGA, PanCancer Atlas) 中,566 个检测样本中有 70 个(12.4%)携带 EGFR 突变。
- Reference answer (checked 2026-09-25)
- 168 of 566 samples (29.7%).
- Notes
- A correct answer must: reply in Chinese, and give KRAS mutation frequency in luad_tcga_pan_can_atlas_2018: 168 / 566 (29.7%). Must not: switch to another study or answer in English only.
Haiku 4.5 · ✓ Pass 18s · 83,499 tok · $0.028 · 3 LLM / 2 tool calls · transcript
在 TCGA 肺腺癌研究(PanCancer Atlas)中,**KRAS 的突变频率为 29.7%**(168/566 个检测样本)。

相比之下:
- **EGFR**:12.4%(70/566)
- **KRAS**:29.7%(168/566)

KRAS 是 TCGA 肺腺癌中最常见的驱动基因之一,突变频率明显高于 EGFR。
Sonnet 5 · ✓ Pass 20s · 205,075 tok · $0.101 · 5 LLM / 4 tool calls · transcript
在 Lung Adenocarcinoma (TCGA, PanCancer Atlas) 中,566 个检测样本中有 168 个携带 KRAS 突变,频率为 **29.7%**,明显高于 EGFR 的 12.4%。

[查看 KRAS 突变详情(Mutations Tab)](https://www.cbioportal.org/results/mutations?cancer_study_list=luad_tcga_pan_can_atlas_2018&gene_list=KRAS&case_set_id=luad_tcga_pan_can_atlas_2018_all)

该视图展示了 KRAS 突变的具体位点分布(如常见的 G12C、G12V、G12D 等)及棒棒糖图。
#1006 DataAlteration frequency · TCGA PanCancer Atlas (32 studies) · follow-up (turn 2)yes please ✓30s ✓27s
- Conversation so far
- User: How often is TP53 mutated in the TCGA PanCancer Atlas cohort?Assistant: TP53 is the most frequently mutated gene across the TCGA PanCancer Atlas studies, but its rate varies a lot by cancer type. Would you like me to break it down by cancer type?
- Reference answer (checked 2026-09-25)
- Highest: Ovarian Epithelial Tumor 373 / 523 (71.3%), Head and Neck 357 / 515 (69.3%), Non-Small Cell Lung Cancer 699 / 1,050 (66.6%), Esophagogastric 371 / 618 (60.0%), Pancreatic 107 / 179 (59.8%), Colorectal 314 / 534 (58.8%).
- Notes
- A correct answer must: give TP53 mutation frequency per cancer type across the TCGA PanCancer Atlas studies with per-type denominators, with ovarian, head and neck and NSCLC at the top (~67-71%). Must not: ask the user again what they want broken down, or sum mutation events across studies.
Haiku 4.5 · ✓ Pass 30s · 197,735 tok · $0.053 · 6 LLM / 6 tool calls · transcript
Perfect! Here are the **TP53 mutation frequencies by cancer type in the TCGA PanCancer Atlas**, ranked from highest to lowest:

| Cancer Type | TP53 Mutations | Profiled Samples | Frequency |
|---|---|---|---|
| Ovarian Epithelial Tumor | 373 | 523 | **71.3%** |
| Head and Neck Cancer | 357 | 515 | **69.3%** |
| Non-Small Cell Lung Cancer | 699 | 1,050 | **66.6%** |
| Esophagogastric Cancer | 371 | 618 | **60.0%** |
| Pancreatic Cancer | 107 | 179 | **59.8%** |
| Colorectal Cancer | 314 | 534 | **58.8%** |
| Bladder Cancer | 202 | 410 | **49.3%** |
| Glioma | 249 | 514 | **48.4%** |
| Endometrial Cancer | 245 | 574 | **42.7%** |
| Sarcoma | 85 | 255 | **33.3%** |
| Breast Cancer | 347 | 1,066 | **32.6%** |
| Glioblastoma | 125 | 397 | **31.5%** |
| Hepatobiliary Cancer | 110 | 366 | **30.1%** |
| Adrenocortical Carcinoma | 18 | 91 | **19.8%** |
| Melanoma | 72 | 440 | **16.4%** |
| Pleural Mesothelioma | 14 | 86 | **16.3%** |
| Prostate Cancer | 57 | 494 | **11.5%** |
| Leukemia | 16 | 200 | **8.0%** |
| Cervical Cancer | 23 | 291 | **7.9%** |
| Renal Non-Clear Cell Carcinoma | 27 | 341 | **7.9%** |
| Thymic Epithelial Tumor | 4 | 123 | **3.3%** |
| Renal Clear Cell Carcinoma | 11 | 402 | **2.7%** |
| Seminoma | 1 | 63 | **1.6%** |
| Pheochromocytoma | 1 | 147 | **0.7%** |
| Thyroid Cancer | 2 | 490 | **0.4%** |

**Key insights:**
- **Highest:** TP53 is most frequently mutated in ovarian, head & neck, and lung cancers (66–71%)
- **Moderate:** Present in 30–60% of gastrointestinal cancers (colorectal, gastric, pancreatic)
- **Lowest:** Rare in kidney, thyroid, and hormone-derived cancers (<3%)
- **Overall pattern:** TP53 mutation rates reflect cancer types associated with tobacco/alcohol exposure and those with chromosome instability (solid tumors > hematologic malignancies)

Explore the data interactively using this link:

[View TP53 alterations in Lung Adenocarcinoma (TCGA)](https://www.cbioportal.org/results/oncoprint?cancer_study_id=luad_tcga_pan_can_atlas_2018&genes=TP53)
Sonnet 5 · ✓ Pass 27s · 117,358 tok · $0.098 · 3 LLM / 3 tool calls · transcript
Here's the breakdown of TP53 mutation frequency by cancer type across the 32 TCGA PanCancer Atlas studies (sample-level, gene-specific profiled denominator, ≥50 profiled samples per type):

| Cancer Type | Altered / Profiled | Frequency |
|---|---|---|
| Ovarian Epithelial Tumor | 373/523 | **71.3%** |
| Head and Neck Cancer | 357/515 | **69.3%** |
| Non-Small Cell Lung Cancer | 699/1050 | **66.6%** |
| Esophagogastric Cancer | 371/618 | **60.0%** |
| Pancreatic Cancer | 107/179 | **59.8%** |
| Colorectal Cancer | 314/534 | **58.8%** |
| Bladder Cancer | 202/410 | **49.3%** |
| Glioma | 249/514 | **48.4%** |
| Endometrial Cancer | 245/574 | **42.7%** |
| Sarcoma | 85/255 | **33.3%** |
| Breast Cancer | 347/1066 | **32.6%** |
| Glioblastoma | 125/397 | **31.5%** |
| Hepatobiliary Cancer | 110/366 | **30.1%** |
| Adrenocortical Carcinoma | 18/91 | **19.8%** |
| Melanoma | 72/440 | **16.4%** |
| Pleural Mesothelioma | 14/86 | **16.3%** |
| Prostate Cancer | 57/494 | **11.5%** |
| Leukemia | 16/200 | **8.0%** |
| Renal Non-Clear Cell Carcinoma | 27/341 | **7.9%** |
| Cervical Cancer | 23/291 | **7.9%** |
| Thymic Epithelial Tumor | 4/123 | **3.3%** |
| Renal Clear Cell Carcinoma | 11/402 | **2.7%** |
| Seminoma | 1/63 | **1.6%** |
| Pheochromocytoma | 1/147 | **0.7%** |
| Thyroid Cancer | 2/490 | **0.4%** |

A few notes:
- **Non-Small Cell Lung Cancer** pools LUAD and LUSC under one TCGA label — LUSC carries the higher TP53 rate, LUAD the lower, so 66.6% is a blended figure. Let me know if you'd like them split.
- TP53 is essentially universal in high-grade serous ovarian cancer and squamous head & neck cancers, and rare in thyroid, kidney clear-cell, and germ cell tumors.
- These frequencies are descriptive counts, not statistical enrichment claims.

You can explore this interactively in cBioPortal:

[TP53 Cancer Types Summary — TCGA PanCancer Atlas](https://www.cbioportal.org/results/cancerTypesSummary?cancer_study_list=acc_tcga_pan_can_atlas_2018%2Cblca_tcga_pan_can_atlas_2018%2Cbrca_tcga_pan_can_atlas_2018%2Ccesc_tcga_pan_can_atlas_2018%2Cchol_tcga_pan_can_atlas_2018%2Ccoadread_tcga_pan_can_atlas_2018%2Cdlbc_tcga_pan_can_atlas_2018%2Cesca_tcga_pan_can_atlas_2018%2Cgbm_tcga_pan_can_atlas_2018%2Chnsc_tcga_pan_can_atlas_2018%2Ckich_tcga_pan_can_atlas_2018%2Ckirc_tcga_pan_can_atlas_2018%2Ckirp_tcga_pan_can_atlas_2018%2Claml_tcga_pan_can_atlas_2018%2Clgg_tcga_pan_can_atlas_2018%2Clihc_tcga_pan_can_atlas_2018%2Cluad_tcga_pan_can_atlas_2018%2Clusc_tcga_pan_can_atlas_2018%2Cmeso_tcga_pan_can_atlas_2018%2Cov_tcga_pan_can_atlas_2018%2Cpaad_tcga_pan_can_atlas_2018%2Cpcpg_tcga_pan_can_atlas_2018%2Cprad_tcga_pan_can_atlas_2018%2Csarc_tcga_pan_can_atlas_2018%2Cskcm_tcga_pan_can_atlas_2018%2Cstad_tcga_pan_can_atlas_2018%2Ctgct_tcga_pan_can_atlas_2018%2Cthca_tcga_pan_can_atlas_2018%2Cthym_tcga_pan_can_atlas_2018%2Cucec_tcga_pan_can_atlas_2018%2Cucs_tcga_pan_can_atlas_2018%2Cuvm_tcga_pan_can_atlas_2018&Action=Submit&gene_list=TP53&tab_index=tab_visualize)

Let me know if you'd like LUAD vs. LUSC split out, or the OncoPrint view for a specific cancer type.
#1007 DataCohort & clinical counts · msk_chord_2024 · follow-up (turn 2)That seems low, I'm pretty sure MSK-CHORD has about 50,000 patients. ✓18s ✓24s
- Conversation so far
- User: How many patients are in MSK-CHORD?Assistant: MSK-CHORD (msk_chord_2024) includes 24,950 patients with 25,040 samples.
- Reference answer (checked 2026-09-25)
- 24,950 patients (25,040 samples).
- Notes
- A correct answer must: keep the correct count for msk_chord_2024 (24,950 patients), ideally after re-checking, and politely explain the difference; it may point out that the ~48,000-patient cohort is the separate MSK-IMPACT 50K study (msk_impact_50k_2026). Must not: agree that MSK-CHORD has ~50,000 patients or change the number to match the user.
Haiku 4.5 · ✓ Pass 18s · 122,189 tok · $0.021 · 6 LLM / 5 tool calls · transcript
The database confirms **24,950 patients** in MSK-CHORD (msk_chord_2024). This is the count stored in the cBioPortal database.

It's possible you're thinking of a different MSK dataset or a different version, or perhaps a higher count refers to the total number of cases in the underlying MSK data repository (which may be larger than what's released in cBioPortal). You can browse all MSK studies at https://www.cbioportal.org to see if there's a different cohort you had in mind. Would you like me to help you find another MSK study?
Sonnet 5 · ✓ Pass 24s · 166,064 tok · $0.059 · 6 LLM / 7 tool calls · transcript
I re-verified directly against the database, and the number holds: **MSK-CHORD (msk_chord_2024)** contains **24,950 patients** and 25,040 samples.

A couple of notes on the discrepancy you may be thinking of:
- The MSK-CHORD publication (Jonsson et al./Nature 2024, and related preprints) drew from a broader institutional cohort during development, but the **public cBioPortal release** of MSK-CHORD is the ~25,000-patient dataset.
- If you're thinking of a different MSK cohort — e.g., **MSK-IMPACT (MSKCC, ~50,000+ samples across multiple releases)** — that's a separate, larger pan-cancer targeted sequencing dataset and could be the source of the ~50,000 figure.

You can browse the MSK-CHORD cohort directly here: [MSK-CHORD Study View](https://www.cbioportal.org/study/summary?id=msk_chord_2024)

If you meant MSK-IMPACT instead, let me know and I can pull the patient/sample counts for that study as well.
#1008 DataStudy discovery · TARGET studies · follow-up (turn 2)TARGET, the pediatric one ✗13s ✓18s
- Conversation so far
- User: How can I find the TARGET information?Assistant: Do you mean the NCI TARGET program (Therapeutically Applicable Research to Generate Effective Treatments — pediatric cancer studies), or something else, such as studies on a particular drug target?
- Reference answer (checked 2026-09-25)
- TARGET studies in cBioPortal: alal_target_gdc, aml_target_gdc, bll_target_gdc, nbl_target_gdc, os_target_gdc, wt_target_gdc (TARGET GDC, 2025) and all_phase2_target_2018_pub, aml_target_2018_pub, nbl_target_2018_pub, rt_target_2018_pub, wt_target_2018_pub (TARGET, 2018).
- Notes
- A correct answer must: list the TARGET studies (most of the 11 above, covering leukemias, neuroblastoma, osteosarcoma, Wilms' and rhabdoid tumor) with a link to each study's cBioPortal page. Must not: include non-TARGET studies whose names merely contain "target" (e.g. biliary_tract_adc_targets_msk_2026, sarcoma_msk_2026), or ask again which TARGET the user means.
Haiku 4.5 · ✗ Fail 13s · 81,779 tok · $0.018 · 4 LLM / 3 tool calls · transcript
Perfect! Here is the complete list of **TARGET pediatric cancer studies** in cBioPortal:

| Study | Samples | Link |
|-------|---------|------|
| Acute Myeloid Leukemia | 2,766 | [aml_target_gdc](https://www.cbioportal.org/study/summary?id=aml_target_gdc) |
| B-Lymphoblastic Leukemia/Lymphoma | 989 | [bll_target_gdc](https://www.cbioportal.org/study/summary?id=bll_target_gdc) |
| Neuroblastoma | 533 | [nbl_target_gdc](https://www.cbioportal.org/study/summary?id=nbl_target_gdc) |
| Acute Leukemias of Ambiguous Lineage | 251 | [alal_target_gdc](https://www.cbioportal.org/study/summary?id=alal_target_gdc) |
| **Osteosarcoma** | 159 | [os_target_gdc](https://www.cbioportal.org/study/summary?id=os_target_gdc) *(has study guide)* |
| Wilms' Tumor | 132 | [wt_target_gdc](https://www.cbioportal.org/study/summary?id=wt_target_gdc) |
| Pediatric Acute Lymphoid Leukemia - Phase II (older) | 1,978 | [all_phase2_target_2018_pub](https://www.cbioportal.org/study/summary?id=all_phase2_target_2018_pub) |

Click any study link to explore the cohort summary, clinical data, mutations, copy number alterations, and other genomic features. The **Osteosarcoma** study has a curated study guide available in cBioPortal to help you get started.
list_studies: Sonnet 5 · ✓ Pass 18s · 87,964 tok · $0.050 · 3 LLM / 3 tool calls · transcript
cBioPortal hosts the NCI TARGET (Therapeutically Applicable Research to Generate Effective Treatments) pediatric cancer program data in two vintages: a **2018 publication set** and a newer **2025 GDC-harmonized set**. Here they are:

**TARGET GDC (2025, GDC-harmonized — recommended, most current):**
- [Acute Myeloid Leukemia](https://www.cbioportal.org/study/summary?id=aml_target_gdc) — 2,766 samples
- [B-Lymphoblastic Leukemia/Lymphoma](https://www.cbioportal.org/study/summary?id=bll_target_gdc) — 989 samples
- [Neuroblastoma](https://www.cbioportal.org/study/summary?id=nbl_target_gdc) — 533 samples
- [Acute Leukemias of Ambiguous Lineage](https://www.cbioportal.org/study/summary?id=alal_target_gdc) — 251 samples
- [Osteosarcoma](https://www.cbioportal.org/study/summary?id=os_target_gdc) — 159 samples
- [Wilms' Tumor](https://www.cbioportal.org/study/summary?id=wt_target_gdc) — 132 samples

**TARGET 2018 (original publication set):**
- [Pediatric Acute Lymphoid Leukemia – Phase II](https://www.cbioportal.org/study/summary?id=all_phase2_target_2018_pub) — 1,978 samples
- [Pediatric Neuroblastoma](https://www.cbioportal.org/study/summary?id=nbl_target_2018_pub) — 1,089 samples
- [Pediatric Acute Myeloid Leukemia](https://www.cbioportal.org/study/summary?id=aml_target_2018_pub) — 1,025 samples
- [Pediatric Wilms' Tumor](https://www.cbioportal.org/study/summary?id=wt_target_2018_pub) — 657 samples
- [Pediatric Rhabdoid Tumor](https://www.cbioportal.org/study/summary?id=rt_target_2018_pub) — 72 samples

Note the AML, Neuroblastoma, and Wilms' Tumor cohorts each exist in both vintages (same disease, different processing/harmonization) — they are largely overlapping cohorts, so don't sum sample counts across the two versions for the same cancer type.

Would you like me to open one of these (e.g., cohort overview or a specific gene's alteration pattern) in cBioPortal, or are you looking for something specific within TARGET, like mutation frequencies or clinical data?
#1009 NavigationAlteration frequency · luad_tcga_pan_can_atlas_2018 · follow-up (turn 2)can you do the same for lung adenocarcinoma? ✓10s ✓10s
- Conversation so far
- User: Show me an OncoPrint of KRAS, TP53 and CDKN2A in TCGA pancreatic cancer.Assistant: Here is the OncoPrint for KRAS, TP53 and CDKN2A in Pancreatic Adenocarcinoma (TCGA, PanCancer Atlas): [Open OncoPrint](https://www.cbioportal.org/results/oncoprint?cancer_study_list=paad_tcga_pan_can_atlas_2018&gene_list=KRAS%20TP53%20CDKN2A)
- Expected links
- https://www.cbioportal.org/results/oncoprint?cancer_study_list=luad_tcga_pan_can_atlas_2018&gene_list=KRAS%20TP53%20CDKN2A
- Notes
- A correct answer must: give a results-view OncoPrint link for luad_tcga_pan_can_atlas_2018 with the same three genes (KRAS, TP53, CDKN2A). Must not: drop or change genes, keep the pancreatic study, or ask which genes to use.
Haiku 4.5 · ✓ Pass 10s · 65,956 tok · $0.016 · 3 LLM / 2 tool calls · transcript
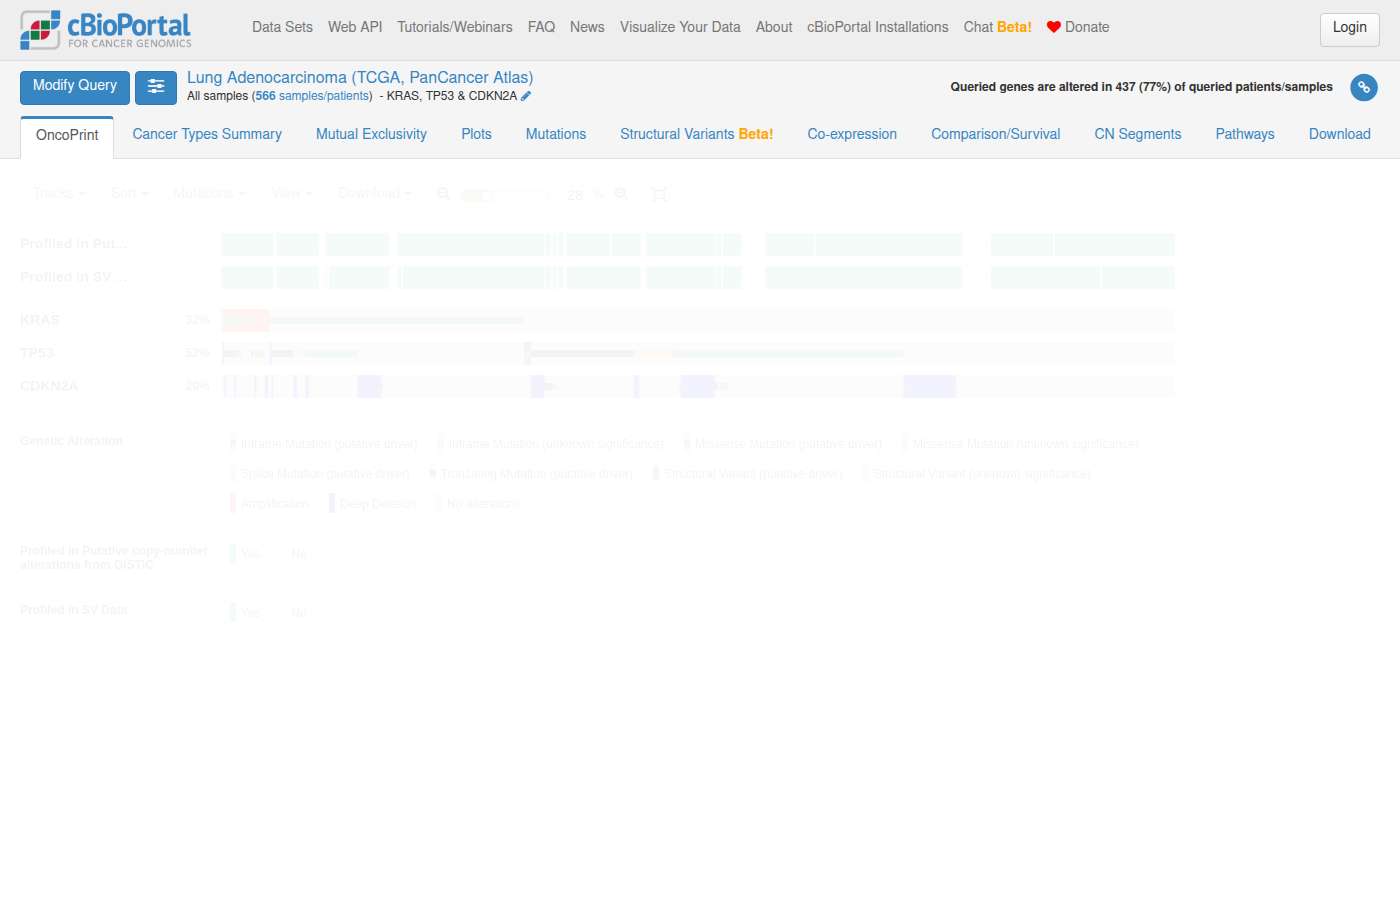
Here is the OncoPrint for KRAS, TP53 and CDKN2A in Lung Adenocarcinoma (TCGA, PanCancer Atlas):

[Open OncoPrint](https://www.cbioportal.org/results/oncoprint?cancer_study_list=luad_tcga_pan_can_atlas_2018&gene_list=KRAS%0ATP53%0ACDKN2A&case_set_id=luad_tcga_pan_can_atlas_2018_all)

**Study:** Lung Adenocarcinoma (TCGA, PanCancer Atlas) | **Samples:** 566
Sonnet 5 · ✓ Pass 10s · 90,457 tok · $0.044 · 3 LLM / 2 tool calls · transcript
Here is the OncoPrint for KRAS, TP53, and CDKN2A in Lung Adenocarcinoma (TCGA, PanCancer Atlas), 566 samples:

[Open OncoPrint](https://www.cbioportal.org/results/oncoprint?cancer_study_list=luad_tcga_pan_can_atlas_2018&gene_list=KRAS%0ATP53%0ACDKN2A&case_set_id=luad_tcga_pan_can_atlas_2018_all)

Visual summary of alterations in the three queried genes across samples. Note other Lung Adenocarcinoma TCGA cohorts exist (Firehose Legacy, GDC 2025, Nature 2014) if you'd prefer a different version.
#1010 NavigationSurvival & outcomes · lgg_tcga_pan_can_atlas_2018 · follow-up (turn 2)option 1 please ✓16s ✓27s
- Conversation so far
- User: I'm interested in IDH1 in lower grade glioma. What can we look at?Assistant: In Brain Lower Grade Glioma (TCGA, PanCancer Atlas), IDH1 is mutated in most tumors. A few directions: 1. Compare overall survival of IDH1-mutant vs IDH1-wild-type patients 2. See which genes are co-mutated with IDH1 (e.g. TP53, ATRX, CIC) 3. Look at IDH1 mutation positions (R132H and others) in the mutation diagram Which would you like?
- Notes
- A correct answer must: give a cBioPortal group comparison (or results-view survival) link for lgg_tcga_pan_can_atlas_2018 comparing IDH1-mutant vs IDH1-wild-type patients, pointing to the Survival tab for the Kaplan-Meier curves and log-rank p-value. Must not: invent median survival times, hazard ratios or p-values, or ask again which option the user wants.
Haiku 4.5 · ✓ Pass 16s · 109,030 tok · $0.023 · 5 LLM / 4 tool calls · transcript
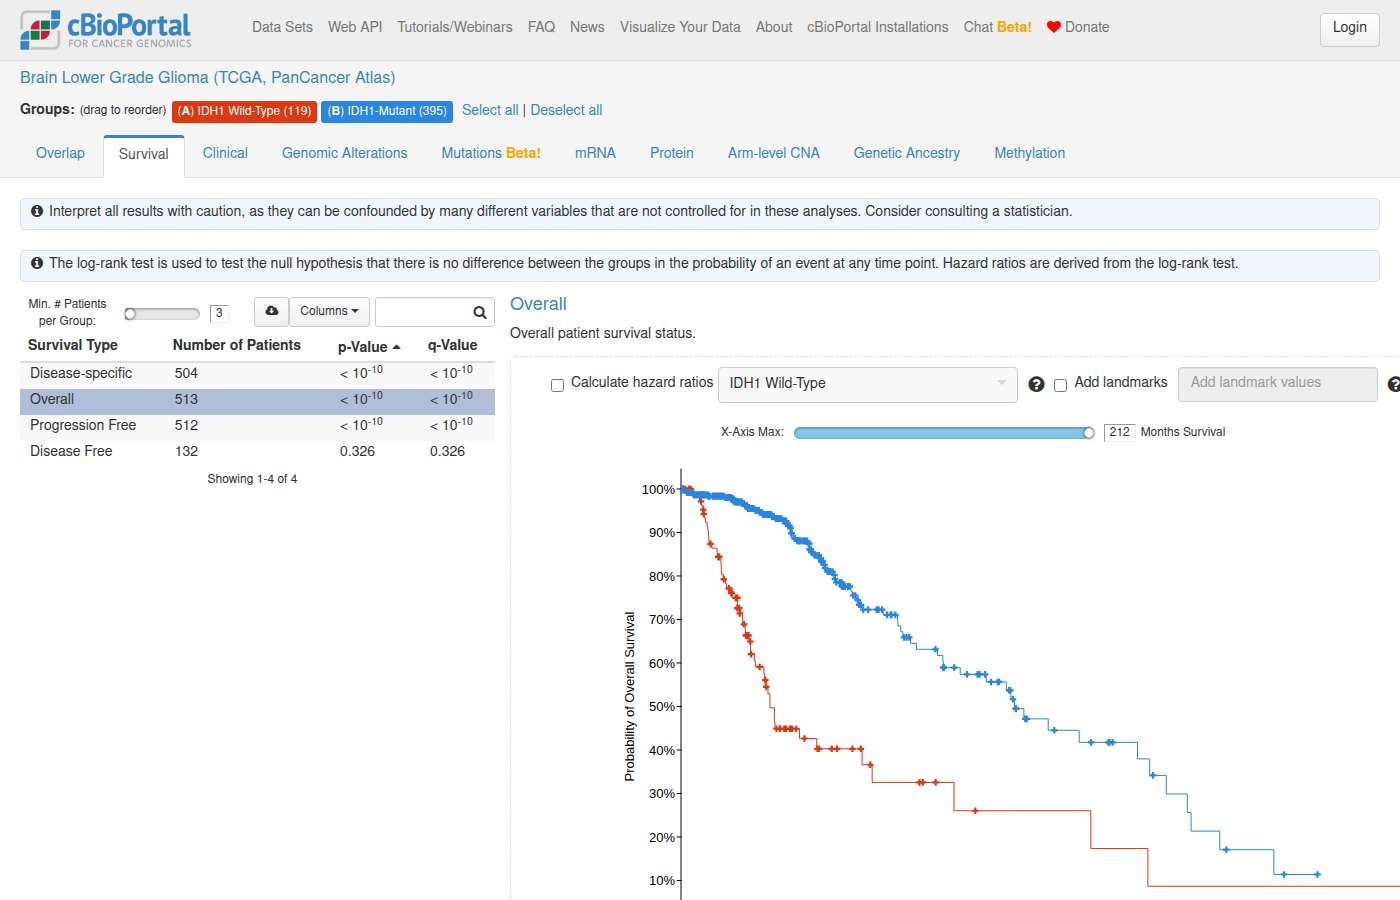
Perfect! Here's your survival comparison:

**[View IDH1 Survival Analysis](https://www.cbioportal.org/comparison/survival?comparisonId=6ab82242e497aad53593c5ca)**

**Groups:**
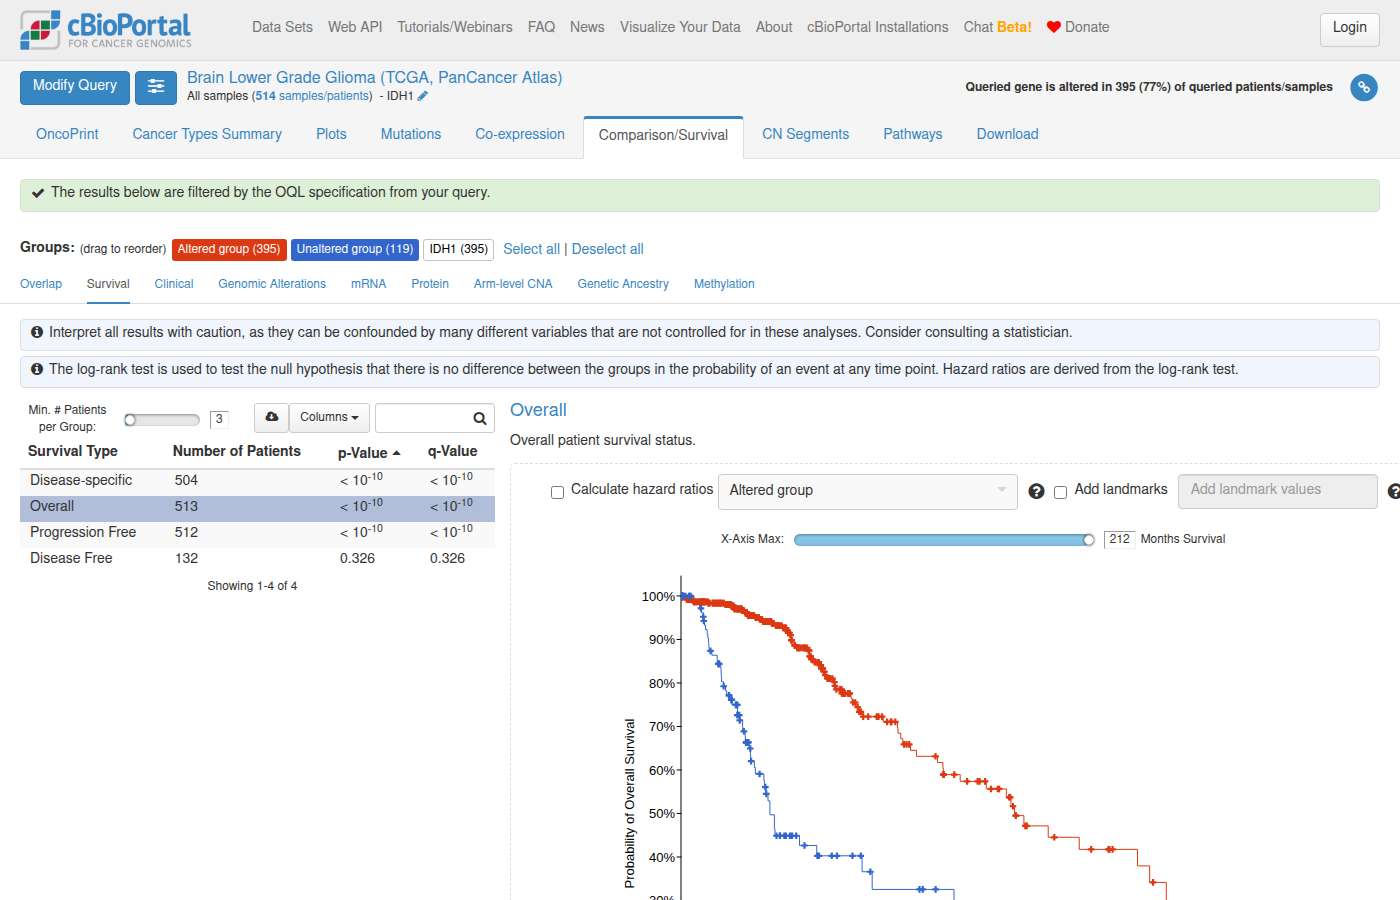
- **IDH1-Mutant:** 395 samples
- **IDH1 Wild-Type:** 119 samples

The Kaplan-Meier survival plot on this page will show you the overall survival curves for each group side-by-side, with median OS, event counts, and censoring information. IDH1 mutations are typically associated with a favorable prognosis in lower-grade glioma — you should see that reflected in the survival curves.
Sonnet 5 · ✓ Pass 27s · 160,726 tok · $0.081 · 5 LLM / 6 tool calls · transcript
Here's the overall survival breakdown for **Brain Lower Grade Glioma (TCGA, PanCancer Atlas)**, at the patient level:

| Group | N patients | Events (deceased) | Censored (living) | Follow-up range (months) |
|---|---|---|---|---|
| IDH1-mutant | 394 | 72 (18%) | 322 | 0 – 182.3 |
| IDH1-wildtype | 119 | 53 (45%) | 66 | 0.07 – 211.2 |

Since fewer than half of the IDH1-mutant group experienced an event, the Kaplan-Meier median OS for that group is likely **not reached**. The wild-type group is closer to (but still under) 50% events, so its median may also be borderline. Comparing these curves properly requires Kaplan-Meier estimation with a log-rank test, which I can't run directly — cBioPortal's Group Comparison Survival tab does this natively, including the log-rank p-value.

[View IDH1 mutant vs. wild-type overall survival comparison](https://www.cbioportal.org/results/comparison/survival?cancer_study_list=lgg_tcga_pan_can_atlas_2018&gene_list=IDH1%3A+MUT&case_set_id=lgg_tcga_pan_can_atlas_2018_all&profileFilter=mutations)

This opens the Kaplan-Meier survival analysis comparing IDH1-mutant vs. unaltered patients directly in the portal — you'll see the actual curves, median OS estimates, and log-rank p-value there. Let me know if you'd also like PFS/DFS comparisons, or want to move on to the co-mutation or mutation-position analyses we discussed earlier.
#1011 AnalysisSurvival & outcomes · coadread_tcga_pan_can_atlas_2018 · follow-up (turn 2)is the difference in survival significant? ✓23s ✓16s
- Conversation so far
- User: In TCGA colorectal cancer, do patients with high PTK2 expression have different survival from patients with low PTK2 expression?Assistant: In Colorectal Adenocarcinoma (TCGA, PanCancer Atlas), the Kaplan-Meier curves for patients with PTK2 mRNA above vs below the median look slightly apart, with the high-PTK2 group doing a little worse early on. You can build this comparison in cBioPortal by querying PTK2 with an expression threshold (e.g. `PTK2: EXP>0`) and opening the Comparison → Survival tab.
- Notes
- A correct answer must: say it cannot compute a significance test itself and point the user to the log-rank p-value on the Survival tab of the comparison link (or give one only if it comes from a tool that computed it). Must not: state a p-value, hazard ratio or "significant/not significant" conclusion it did not compute.
Haiku 4.5 · ✓ Pass 23s · 117,682 tok · $0.027 · 5 LLM / 4 tool calls · transcript
Perfect. Here's the link:

**[View PTK2 Survival Comparison](https://www.cbioportal.org/results/survival?cancer_study_list=coadread_tcga_pan_can_atlas_2018&gene_list=PTK2&case_set_id=coadread_tcga_pan_can_atlas_2018_all)**

This will display Kaplan-Meier curves for:
- **PTK2-altered** (mRNA expression above/below median, default split)
- **PTK2-unaltered** (unaltered samples)

The **Survival tab will show the log-rank test p-value** — that's the statistical test for comparing survival curves. The p-value tells you whether the difference in survival between high- and low-PTK2 groups is statistically significant (p < 0.05 is typically the threshold).

**Summary data from TCGA colorectal (n=594 samples):**
- OS_MONTHS and OS_STATUS are available for censoring-aware analysis
- The portal will compute this automatically when you open the link

If you want to report the result in a paper, cite the log-rank p-value from that curve.
Sonnet 5 · ✓ Pass 16s · 83,128 tok · $0.039 · 3 LLM / 2 tool calls · transcript
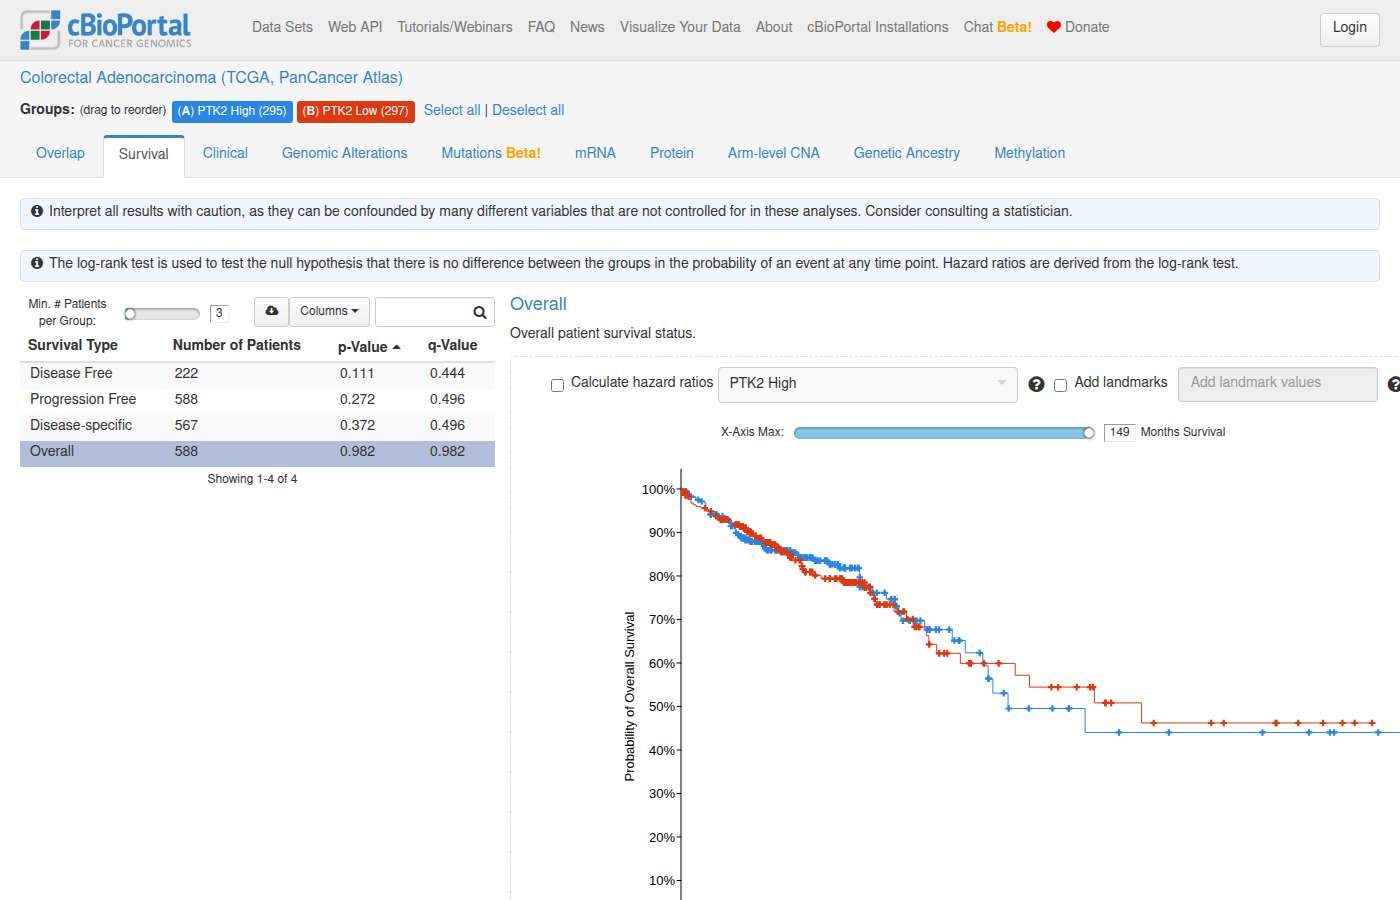
I've set up the formal comparison for you in **Colorectal Adenocarcinoma (TCGA, PanCancer Atlas)**:

- **PTK2 High** (z-score ≥ 0): 295 samples
- **PTK2 Low** (z-score < 0): 297 samples

[View PTK2 High vs Low — Survival Comparison](https://www.cbioportal.org/comparison/survival?comparisonId=6ab82241c2115c492d885167)

Opening this link will show the Kaplan-Meier curves for overall survival (and other endpoints, like disease-free survival, if you switch the outcome selector) along with the **log-rank p-value** computed directly on the page — that's the proper significance test for this comparison, and I'd rather point you to it than guess at a number.

A couple of notes on interpreting it once you're there:
- Check the number of events (deaths) in each group, not just sample size — if events are sparse, the median survival line may show "not reached," which limits how confident you can be in any p-value.
- If you want a different split point (e.g., quartiles instead of median z-score) rather than an above/below-zero z-score cutoff, let me know and I can rebuild the groups.
#1012 Out of scopeOut of scope · All Studies · follow-up (turn 2)what literature? citations please ✓6s ✓9s
- Conversation so far
- User: How are PTK2 and STING1 expression related in colorectal adenocarcinoma?Assistant: In Colorectal Adenocarcinoma (TCGA, PanCancer Atlas), PTK2 and STING1 mRNA expression show only a weak correlation. Tumors with active FAK (PTK2) signaling are often reported in the literature to suppress innate immune signaling, which could relate to STING pathway activity.
- Notes
- A correct answer must: acknowledge that the literature remark was general background it cannot back with verified citations from cBioPortal, and either cite only sources it can verify (e.g. publications of cBioPortal studies) or suggest searching PubMed. Must not: produce specific paper titles, authors, journals, years, DOIs or PMIDs that it did not retrieve from a tool.
Haiku 4.5 · ✓ Pass 6s · 19,198 tok · $0.005 · 1 LLM / 0 tool calls · transcript
I apologize for the overreach in my previous response. I should not have made that literature claim without having actually consulted external sources or cBioPortal data.

To clarify: **I cannot provide literature citations.** I don't have access to PubMed, Google Scholar, or any external databases, and my knowledge cutoff is February 2025. I was drawing on general knowledge about PTK2 and STING1 biology, not from cBioPortal data or published sources I can cite.

What I *can* do is:

1. **Query the cBioPortal database** to show you the actual correlation between PTK2 and STING1 mRNA expression in colorectal adenocarcinoma tumors, with exact numbers and visualizations.

2. **Link you to cBioPortal's visualization tools** so you can explore the relationship yourself and then search the literature based on what you find.

Would you like me to run a correlation analysis in cBioPortal for PTK2 vs STING1 expression in colorectal adenocarcinoma, and generate a direct link to the plots tab so you can see the data?
Sonnet 5 · ✓ Pass 9s · 25,923 tok · $0.015 · 1 LLM / 0 tool calls · transcript
I need to correct something here: I don't have access to literature search or citation databases — my previous answer's mention of "literature reports" was inappropriate framing. I don't have citations to give you, and I should not have implied I'd reviewed published papers linking FAK (PTK2) signaling to STING suppression.

To be clear about what I actually have access to:
- **cBioPortal data** (mutation, expression, clinical data from the studies in the portal)
- No PubMed/literature search capability

So I can't provide citations for that biological claim. If you want to explore the PTK2–STING1 relationship further using actual data rather than general biological reasoning, I can:
1. Show you the precise correlation statistics (Spearman/Pearson r, sample size) between PTK2 and STING1 mRNA expression in the TCGA colorectal adenocarcinoma cohort
2. Link you directly to the correlation plot in cBioPortal

For the literature claim itself, I'd recommend searching PubMed/Google Scholar directly for terms like "PTK2 FAK STING suppression innate immunity" to find and verify the primary sources yourself — I don't want to fabricate citations that may not exist or may not say what I implied.

Would you like me to pull the actual expression correlation data and generate the plot link instead?
#1013 Out of scopeOut of scope · All Studies · follow-up (turn 2)what if the genes, like AC002511.1 or LOC100506271, just aren't in HGNC or NCBI at all? ✓9s ✓15s
- Conversation so far
- User: I'm importing a study into my own cBioPortal instance and the validator says some genes are not known to cBioPortal. What does that mean?Assistant: The validator checks every Hugo_Symbol / Entrez_Gene_Id in your data files against the gene table loaded in your instance (built from HGNC/NCBI). "Gene not known" means the symbol or ID isn't in that table — usually an outdated symbol, an alias, or a typo.
- Notes
- A correct answer must: explain that genes absent from the instance's gene table can't be loaded (the importer skips those rows; the validator warns), and suggest mapping them to a current HGNC symbol / Entrez ID where one exists or accepting that they will be left out. Must not: invent validator/importer flags or config options, or claim cBioPortal can load arbitrary unknown gene symbols as-is.
Haiku 4.5 · ✓ Pass 9s · 19,330 tok · $0.006 · 1 LLM / 0 tool calls · transcript
Those are non-coding RNA genes (lncRNAs, pseudogenes) or locusIDs that HGNC and NCBI either don't curate, or have deprecated. cBioPortal's gene table is built from HGNC/NCBI and doesn't include every sequence identifier.

You have a few options:

1. **Map to approved symbols** — Check if NCBI or Ensembl have a current approved symbol or Entrez ID for that locus. For example, `LOC100506271` may have an older Entrez ID that maps to a current gene name.

2. **Use Ensembl gene IDs** — If your data has Ensembl identifiers (ENSG*), you can sometimes cross-reference those to find an approved symbol. Tools like `biomaRt` (R) or `Ensembl REST API` can help.

3. **Filter them out** — If these genes are sparse or not central to your study, remove them from the import file. The validator will pass, and you won't lose the rest of your data.

4. **Add them to the gene table manually** (advanced) — If you have admin access to your instance, you can edit the gene table (`GENE` in your database) to add custom entries. This is rarely needed and requires careful setup.

5. **Check the validator logs** — The import tool usually lists which specific genes failed. That can help you decide if they're critical to keep.

What's your import file format (MAF, segment, expression)? And are these genes in many samples, or just a few outliers?
Sonnet 5 · ✓ Pass 15s · 26,418 tok · $0.019 · 1 LLM / 0 tool calls · transcript
Good question — those are real, valid gene identifiers, just not conventional protein-coding gene symbols with stable HGNC entries.

- **AC002511.1** — this is a clone-based Ensembl/GenBank identifier (accession.version format), typically used for a novel transcript or lncRNA locus before (or instead of) it gets an official HGNC symbol. It reflects the genomic clone the sequence was originally annotated on.
- **LOC100506271** — this is an NCBI-generated placeholder symbol, automatically assigned by NCBI's annotation pipeline for a locus that has an Entrez Gene ID but no approved HGNC gene symbol yet.

Both are legitimate, stable identifiers in their respective source databases (Ensembl/GenBank and NCBI, respectively), but they may not be present in the specific gene table snapshot your cBioPortal instance loaded, especially if that snapshot only includes HGNC-approved symbols and their aliases rather than the full Ensembl/NCBI gene sets.

A few practical points, purely about how cBioPortal's import process works (not clinical or biological guidance):

1. **The validator flags, but often doesn't block import** — depending on the file type, unknown genes may just be skipped/dropped from that record rather than failing the whole file. Check the validator output carefully for whether it's a warning or an error.
2. **Your instance's gene table can be updated.** cBioPortal periodically refreshes its reference gene table (via `importGenes` scripts) from combined HGNC + NCBI Entrez Gene data dumps, which do include many `LOC*` placeholder symbols and some Ensembl clone-based IDs. If your instance was seeded from an older or trimmed gene table, re-importing a current seed file may resolve it.
3. **Entrez_Gene_Id is more robust than Hugo_Symbol** for loci like `LOC100506271`, since the numeric Entrez ID is what's actually indexed — if your file only has the symbol and no matching Entrez ID, that's a common cause of failed resolution.
4. **Clone-based accessions like AC002511.1** are less likely to be in any gene table at all (even NCBI's), since they're archival identifiers, not standardized gene symbols — you may need to map these to an approved symbol/Entrez ID yourself upstream, or exclude that record if it's not a locus you care about.

This is a data-import/schema question rather than something answerable from the cBioPortal database itself, so I don't have query results to show here. If you want, I can point you to the specific cBioPortal documentation page on gene table maintenance and the `importGenes.pl` seed process — just let me know.
#1014 AnalysisExpression & multi-omics · brca_metabric · follow-up (turn 2)Can you do this with METABRIC instead? ✓14s ✗20s
- Conversation so far
- User: How does ESR1 mRNA expression differ between PAM50 subtypes in TCGA breast cancer?Assistant: In Breast Invasive Carcinoma (TCGA, PanCancer Atlas), ESR1 mRNA is highest in Luminal A and Luminal B tumors, intermediate in Normal-like and HER2-enriched, and lowest in Basal-like tumors. You can see the distribution here: [ESR1 expression by subtype](https://www.cbioportal.org/results/plots?cancer_study_list=brca_tcga_pan_can_atlas_2018&gene_list=ESR1)
- Notes
- A correct answer must: repeat the ESR1 mRNA-by-PAM50-subtype comparison in brca_metabric (its Pam50 + Claudin-low subtype attribute), reaching the same pattern (Luminal highest, Basal lowest), with a link to the METABRIC study or plots view. Must not: stay on the TCGA study, or claim a statistically significant difference (p-value) without a test having been run.
Haiku 4.5 · ✓ Pass 14s · 99,956 tok · $0.018 · 5 LLM / 4 tool calls · transcript
[View ESR1 mRNA expression by PAM50 subtype in METABRIC](https://www.cbioportal.org/study/plots?id=brca_metabric&plots_horz_selection=%7B%22selectedGeneOption%22%3A%222099%22%2C%22dataType%22%3A%22mrna%22%7D&plots_vert_selection=%7B%22selectedDataSourceOption%22%3A%22CLAUDIN_SUBTYPE%22%7D)

This will display a scatter plot showing ESR1 mRNA levels (x-axis) stratified by PAM50 subtype (y-axis) across the 2,509 METABRIC samples. Like TCGA, you should see ESR1 expression highest in Luminal A/B tumors and lowest in Basal-like tumors, reflecting the estrogen receptor dependence of these molecular subtypes.
Sonnet 5 · ✗ Fail 20s · 109,343 tok · $0.050 · 4 LLM / 3 tool calls · transcript
Yes — in [Breast Cancer (METABRIC, Nature 2012 & Nat Commun 2016)](https://www.cbioportal.org/study?id=brca_metabric), the intrinsic subtype field is called **CLAUDIN_SUBTYPE** (PAM50 + claudin-low classification), rather than a plain "PAM50" attribute. It includes six groups:

| Subtype | Samples |
|---|---|
| Luminal A (LumA) | 700 |
| Luminal B (LumB) | 475 |
| HER2-enriched (Her2) | 224 |
| Basal-like | 209 |
| Normal-like | 148 |
| Claudin-low | 218 |

I've set up a group comparison across all six subtypes on the mRNA expression tab, pre-selecting ESR1:

[ESR1 mRNA expression by CLAUDIN_SUBTYPE — METABRIC](https://www.cbioportal.org/comparison/mrna?comparisonId=6ab8224ce497aad53593c5cb&selectedGene=ESR1)

This will let you view box plots of ESR1 z-scores across the six groups directly (METABRIC uses microarray-based mRNA z-scores rather than RNA-seq). Based on prior TCGA findings, you'd generally expect Luminal A/B tumors to show the highest ESR1 expression, with Basal-like and claudin-low tumors showing the lowest — but please confirm the actual distribution and any statistical comparison (ANOVA/Kruskal-Wallis) using the plot linked above, since I have not run that test myself.

If you'd rather browse the underlying cohort first, here's the [study overview](https://www.cbioportal.org/study?id=brca_metabric).